
From Point Cloud to Practical Data: Inside the Ortho Maps Workflow
In the reality capture industry, there’s a well-kept secret most providers don’t want you to know: capturing the data is the easy part. Handing an engineer or architect a raw 50GB hard drive full of billions of points and thousands of drone photos is like handing them a massive pile of bricks and calling it a building. It’s overwhelming, heavy, and frankly, unusable. At Ortho Maps, we know that the real magic doesn't just happen in the field—it happens in the office. Here is a look behind the scenes at how we turn massive amounts of raw data into clean, practical deliverables.
The 4-Step Data Journey
1. Registration & Control: The 3TM Advantage When we leave a site, we have two distinct datasets: high-res aerial photogrammetry from our drones and centimetre-accurate terrestrial LiDAR scans from the ground. But before we stitch them together, we ground them in reality.
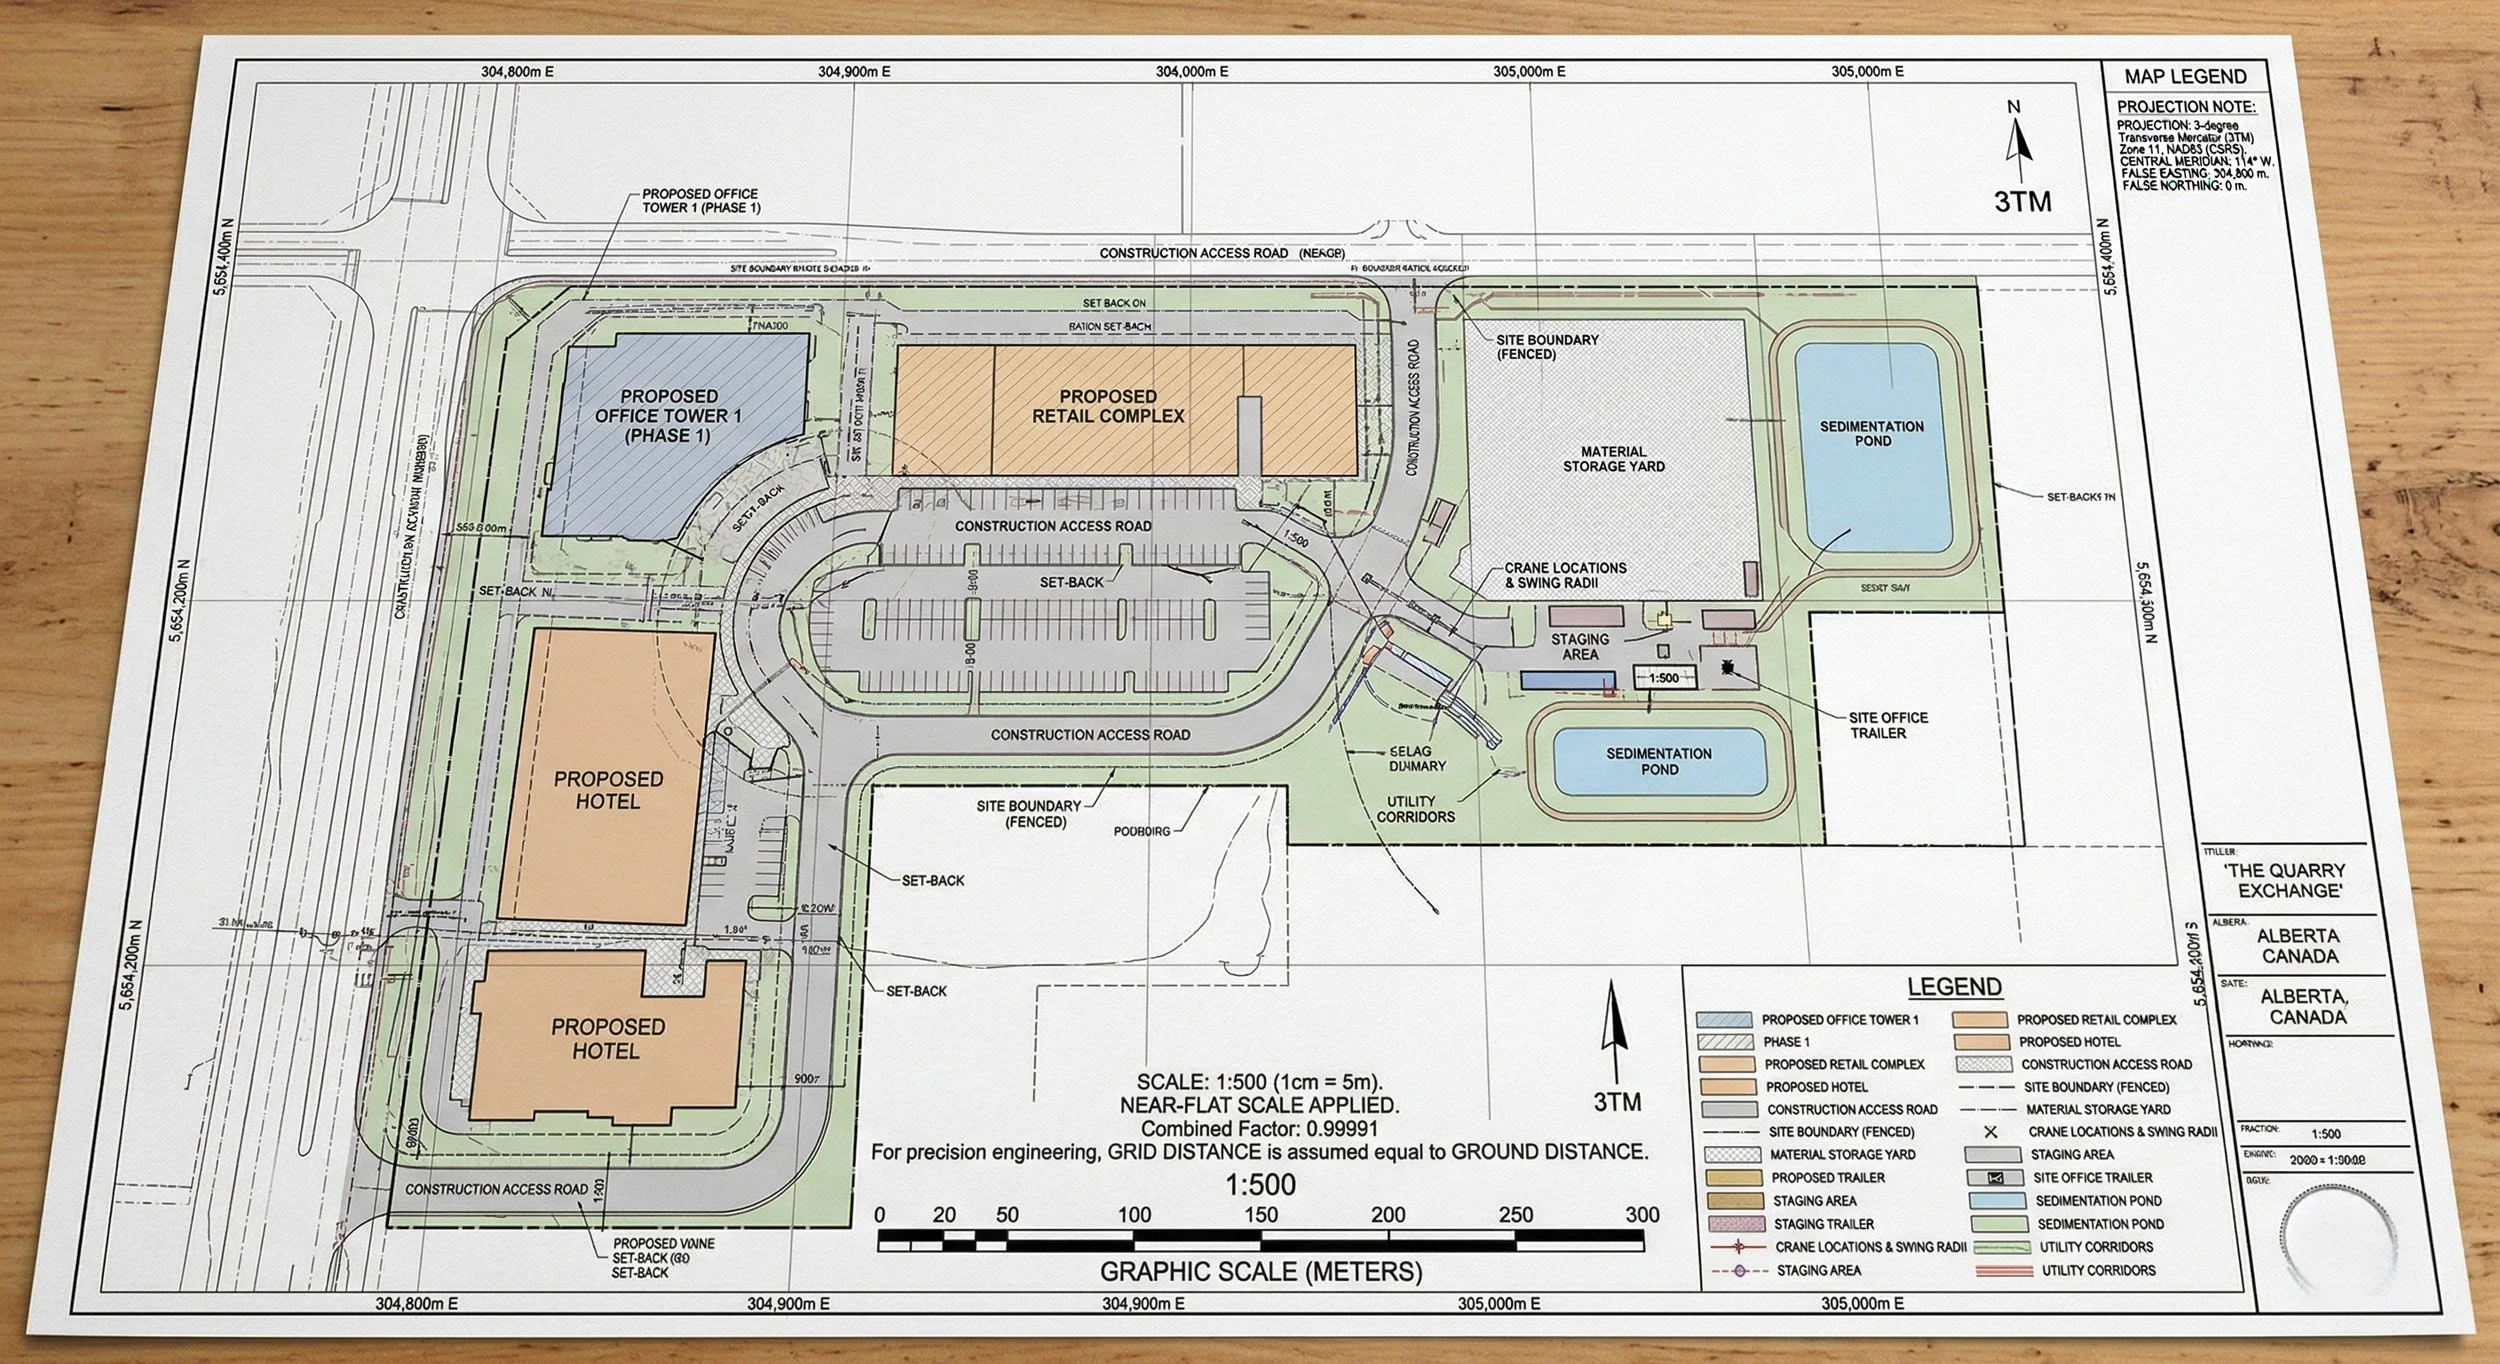
Unlike most drone operators who rely on basic GPS workflows, Ortho Maps uses precisely measured Ground Control Points (GCPs) tied to the Alberta 3TM (3-Degree Transverse Mercator) projection. Because 3TM uses narrower zones than standard UTM, it drastically reduces the scale distortion caused by the curvature of the Earth. This ensures that our "macro" view from the sky and "micro" view from the ground are locked into a highly accurate, distortion-free coordinate system from the very beginning.
2. Cleaning, Classification, & Filtering: Cutting the Noise A laser scanner or photogrammetry dataset captures everything in its line of sight. While that level of detail is impressive, our raw point clouds inevitably include transient "noise" that you definitely don't want in your final CAD file: moving dump trucks, active heavy machinery, scaffolding, temporary stockpiles, or dense vegetation obscuring the terrain.
Handing an engineer an unfiltered dataset means they may base a grading plan on the elevation of a parked bulldozer. To prevent this, our geomatics team puts the raw data through rigorous cleaning and classification protocols. We use advanced algorithms and meticulous manual QA/QC to strip away temporary artifacts and segment the data—separating bare earth from vegetation, and permanent structures from temporary objects. Furthermore, we strategically thin (or decimate) the point cloud in flat, uniform areas to reduce file bloat, preserving the ultra-dense data only where critical geometry changes occur. The result is a clean, lean, and highly accurate representation of the permanent site conditions.
3. Extraction & Modeling: From "Dumb" Points to "Smart" Geometry A point cloud is essentially millions of colored dots suspended in 3D space. While visually stunning for a presentation, it is inherently "dumb" data—standard design software cannot automatically recognize a cluster of points as a fire hydrant, a retaining wall, or a pipe. This is where our specialized drafting and extraction expertise comes into play.
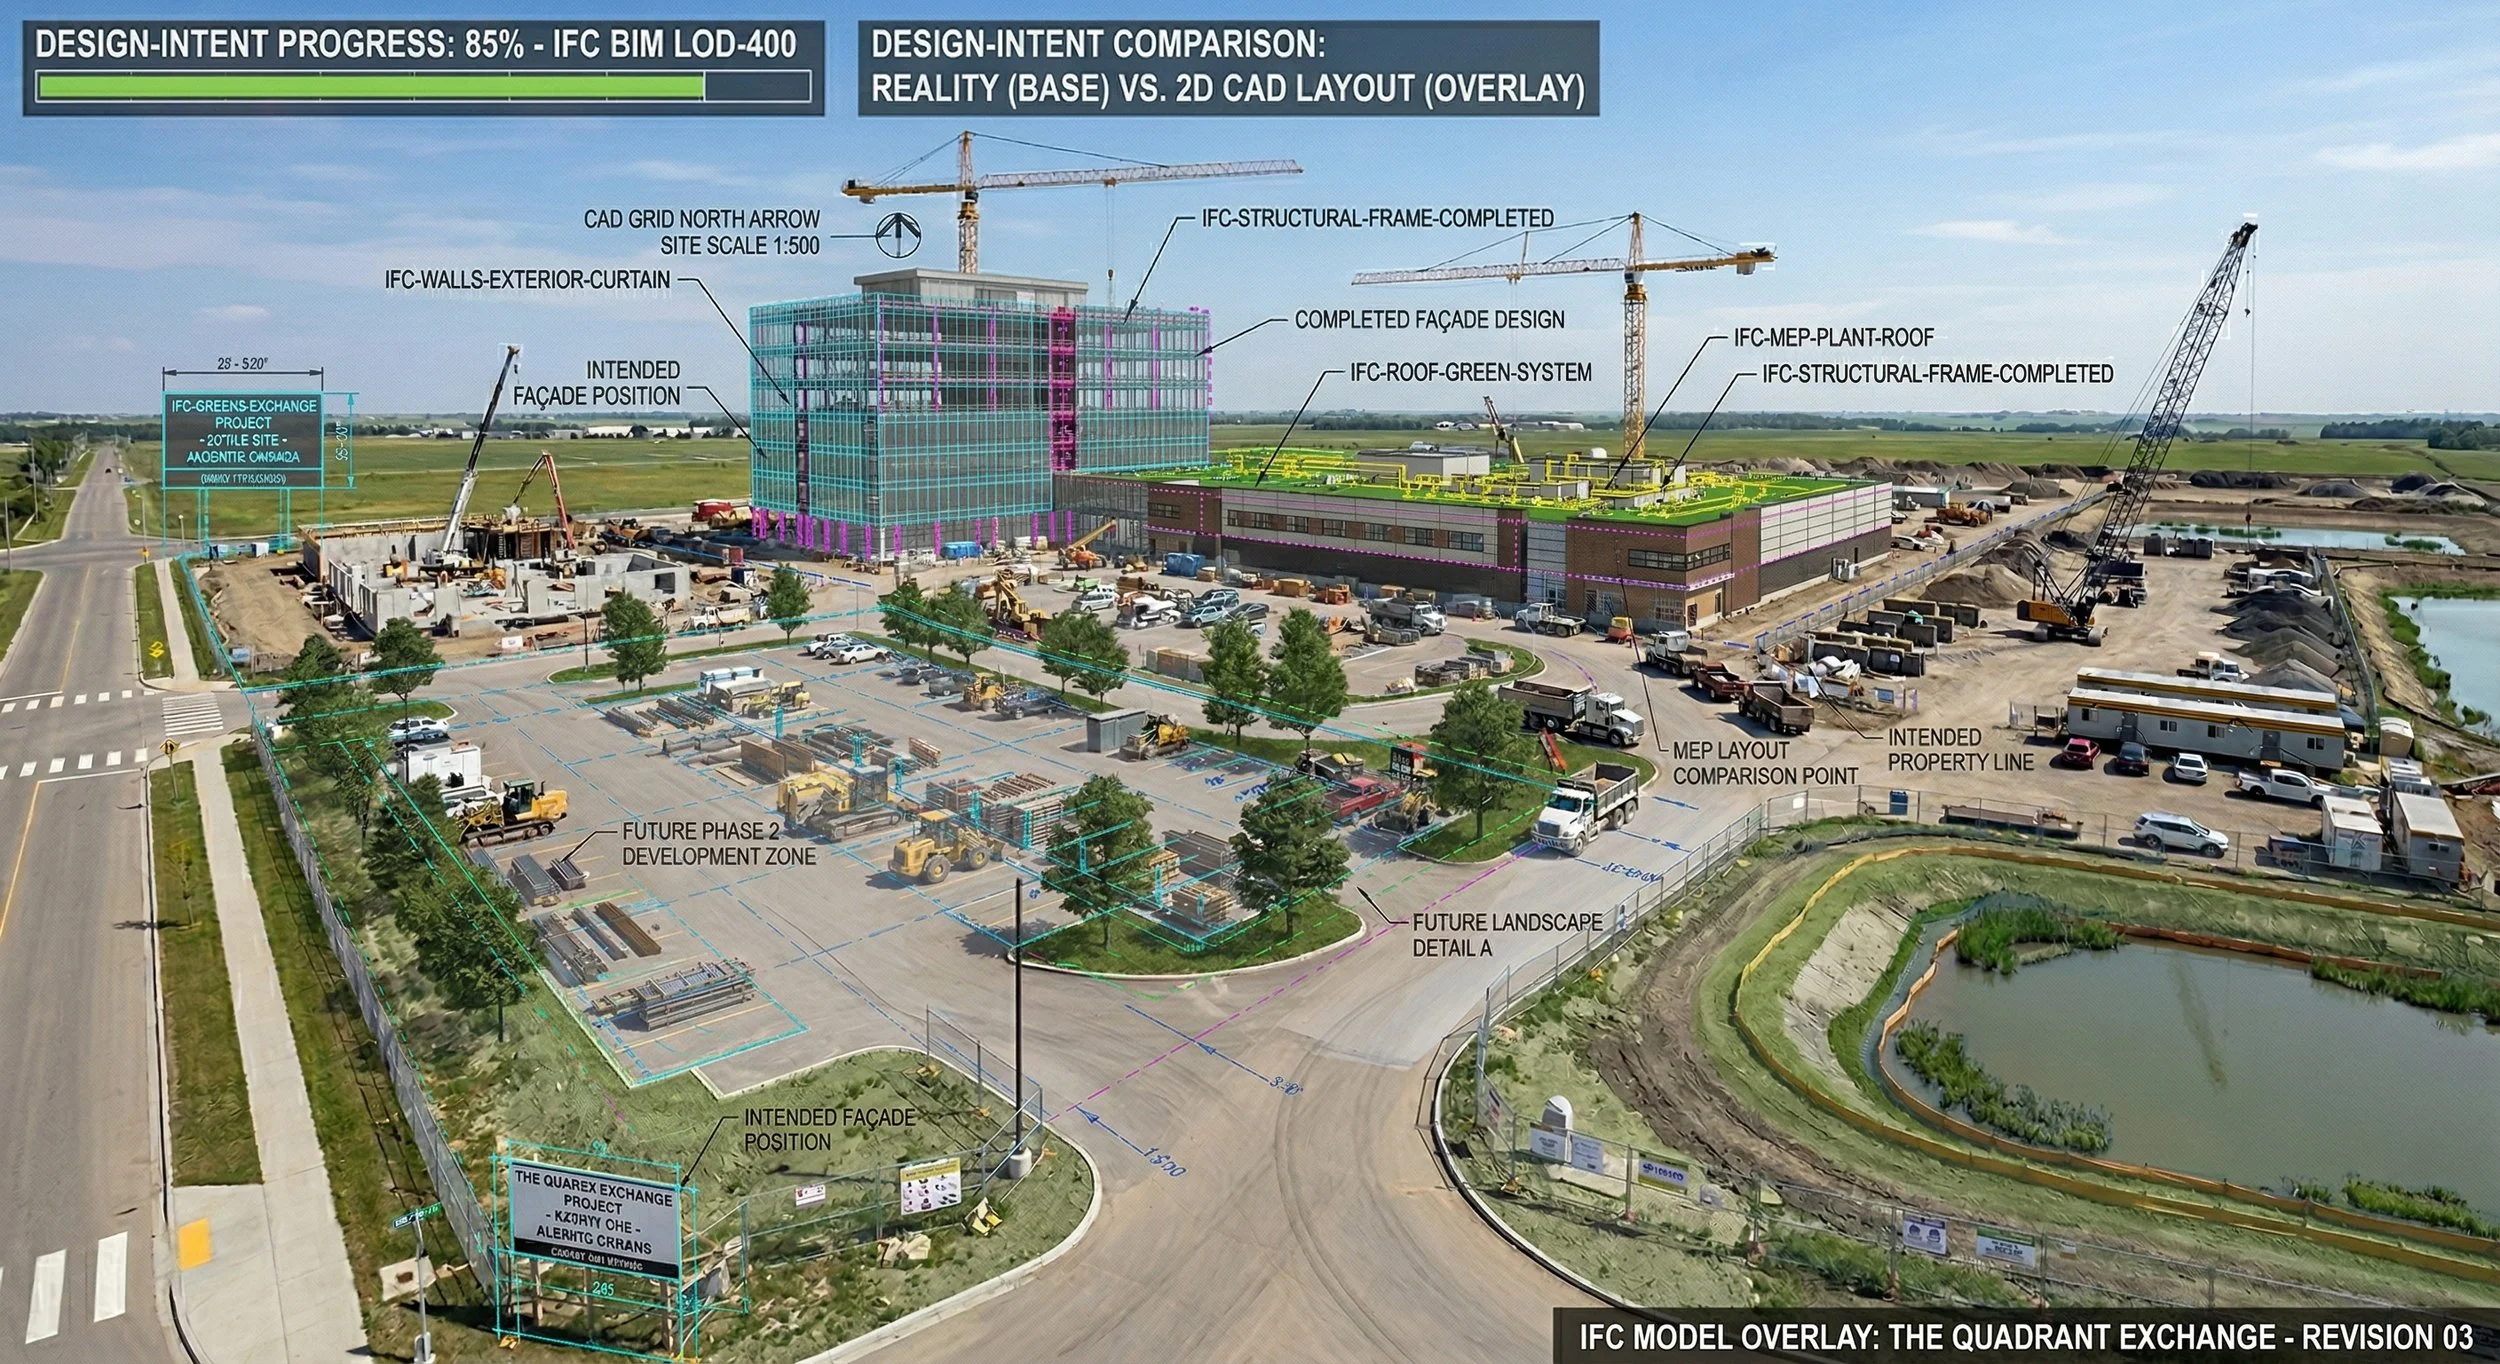
Instead of dumping a massive, unmanageable point cloud onto your engineering team's lap, Ortho Maps translates those points into intelligent, actionable geometry. For civil and site development projects, we extract precise 3D break-lines, generate clean topographic contours, and build highly accurate Digital Terrain Models (DTMs) that capture exact top-of-curb, flowline, and invert elevations. For vertical construction and architectural projects, we utilize a scan-to-BIM workflow, converting raw data into native Revit families and precise 3D architectural, structural, and MEP models. By performing this meticulous extraction in-house, we save your draftspersons and engineers hundreds of hours, allowing them to skip the tedious data-tracing phase and jump straight into design and clash detection.
4. Delivery: True Ground Scale for Flawless CAD & IFC Integration This is where many reality capture providers get it wrong: they deliver spatial data in "grid scale."
The critical problem is map projections inherently distort reality. To represent the curved surface of the Earth on a flat coordinate grid system, a mathematical scale factor must be applied. When you factor in the site's elevation above sea level, these distortions compound. Because of this, a distance that physically measures exactly 100 meters on your job site might be mathematically represented as 99.96 meters in grid coordinates.
But engineers don't build on a grid; they build in the real world. If your design team uses grid-scaled data for physical fabrication, pipe cutting, or tight spatial coordination, those fractional differences quickly multiply into costly physical misalignments on site.
At Ortho Maps, we apply a precisely calculated and localized Combined Scale Factor (CSF) to convert our deliverables from grid coordinates to true ground scale.
Because architects and engineers design in a 1:1 local coordinate system. A true ground-scaled delivery means our point clouds, orthomosaics, and CAD extractions align perfectly with your native IFC models, Revit files, and Civil 3D designs. One unit in our data equals exactly one physical unit on your job site. We eliminate the coordinate alignment headaches, allowing your engineering team to start designing with absolute, engineering-grade confidence the second they open our files.
The Bottom Line: At Ortho Maps, we don't just deliver data; we deliver answers. By handling the rigorous processing, classification, extraction, 3TM control scaling, and ground-level formatting in-house, we ensure your team receives a digital twin that speaks the exact same language as your engineering software.