
GIS & Geospatial Analysis
Turning capture into decisions
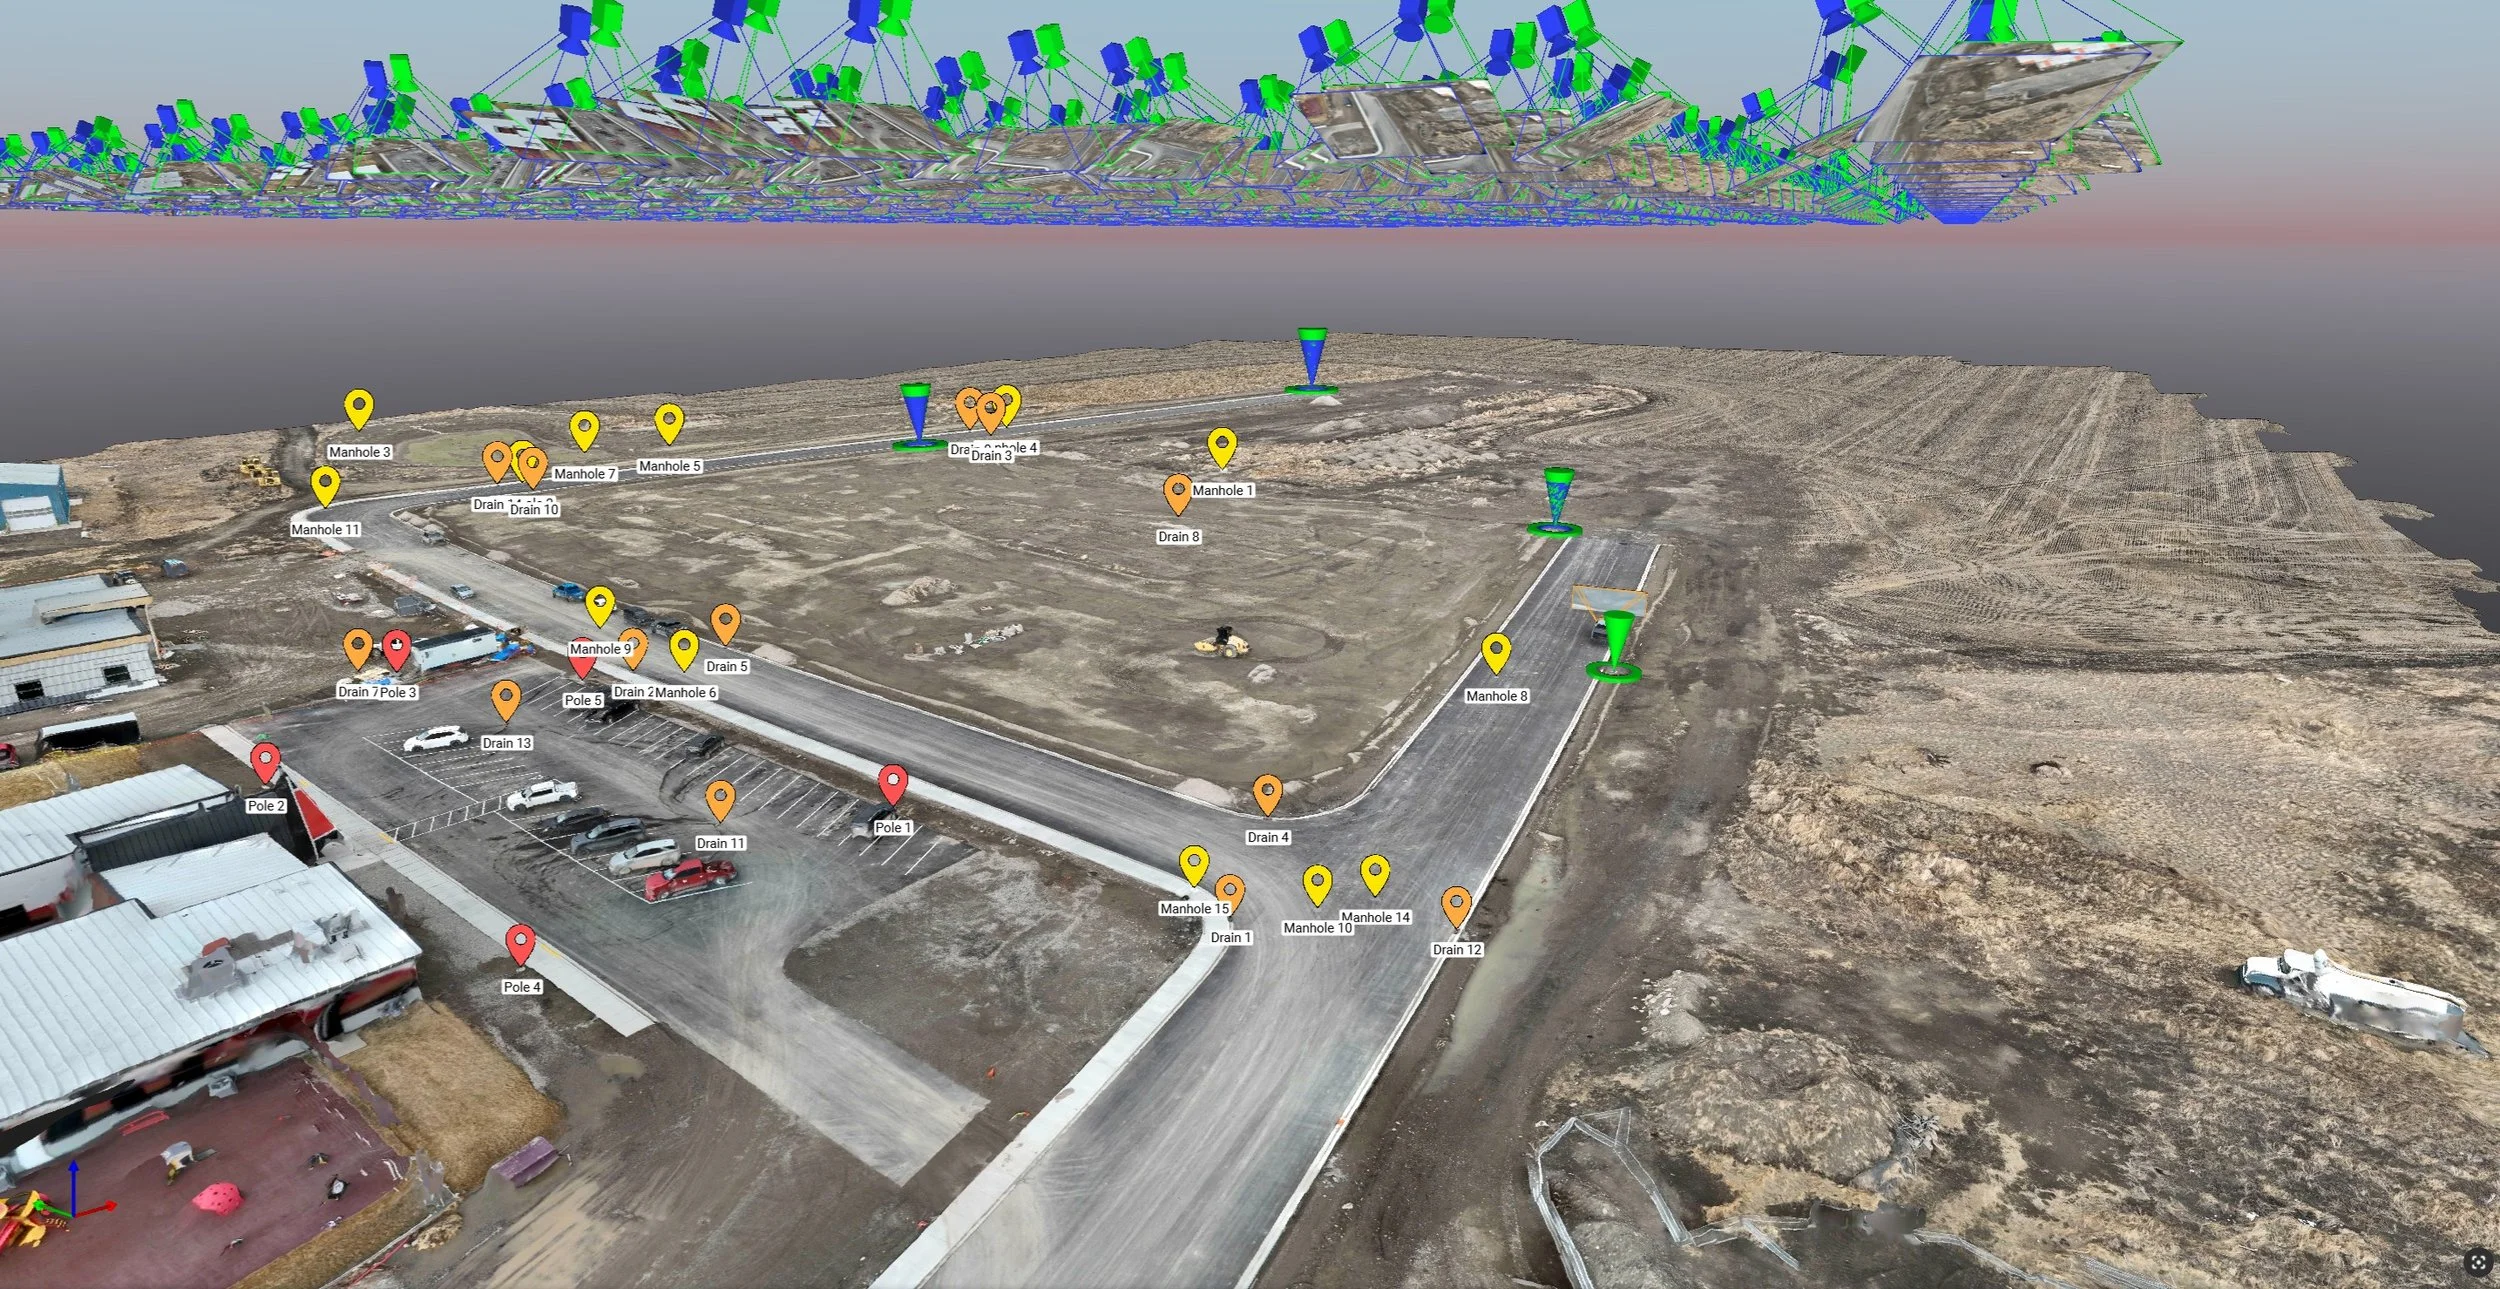
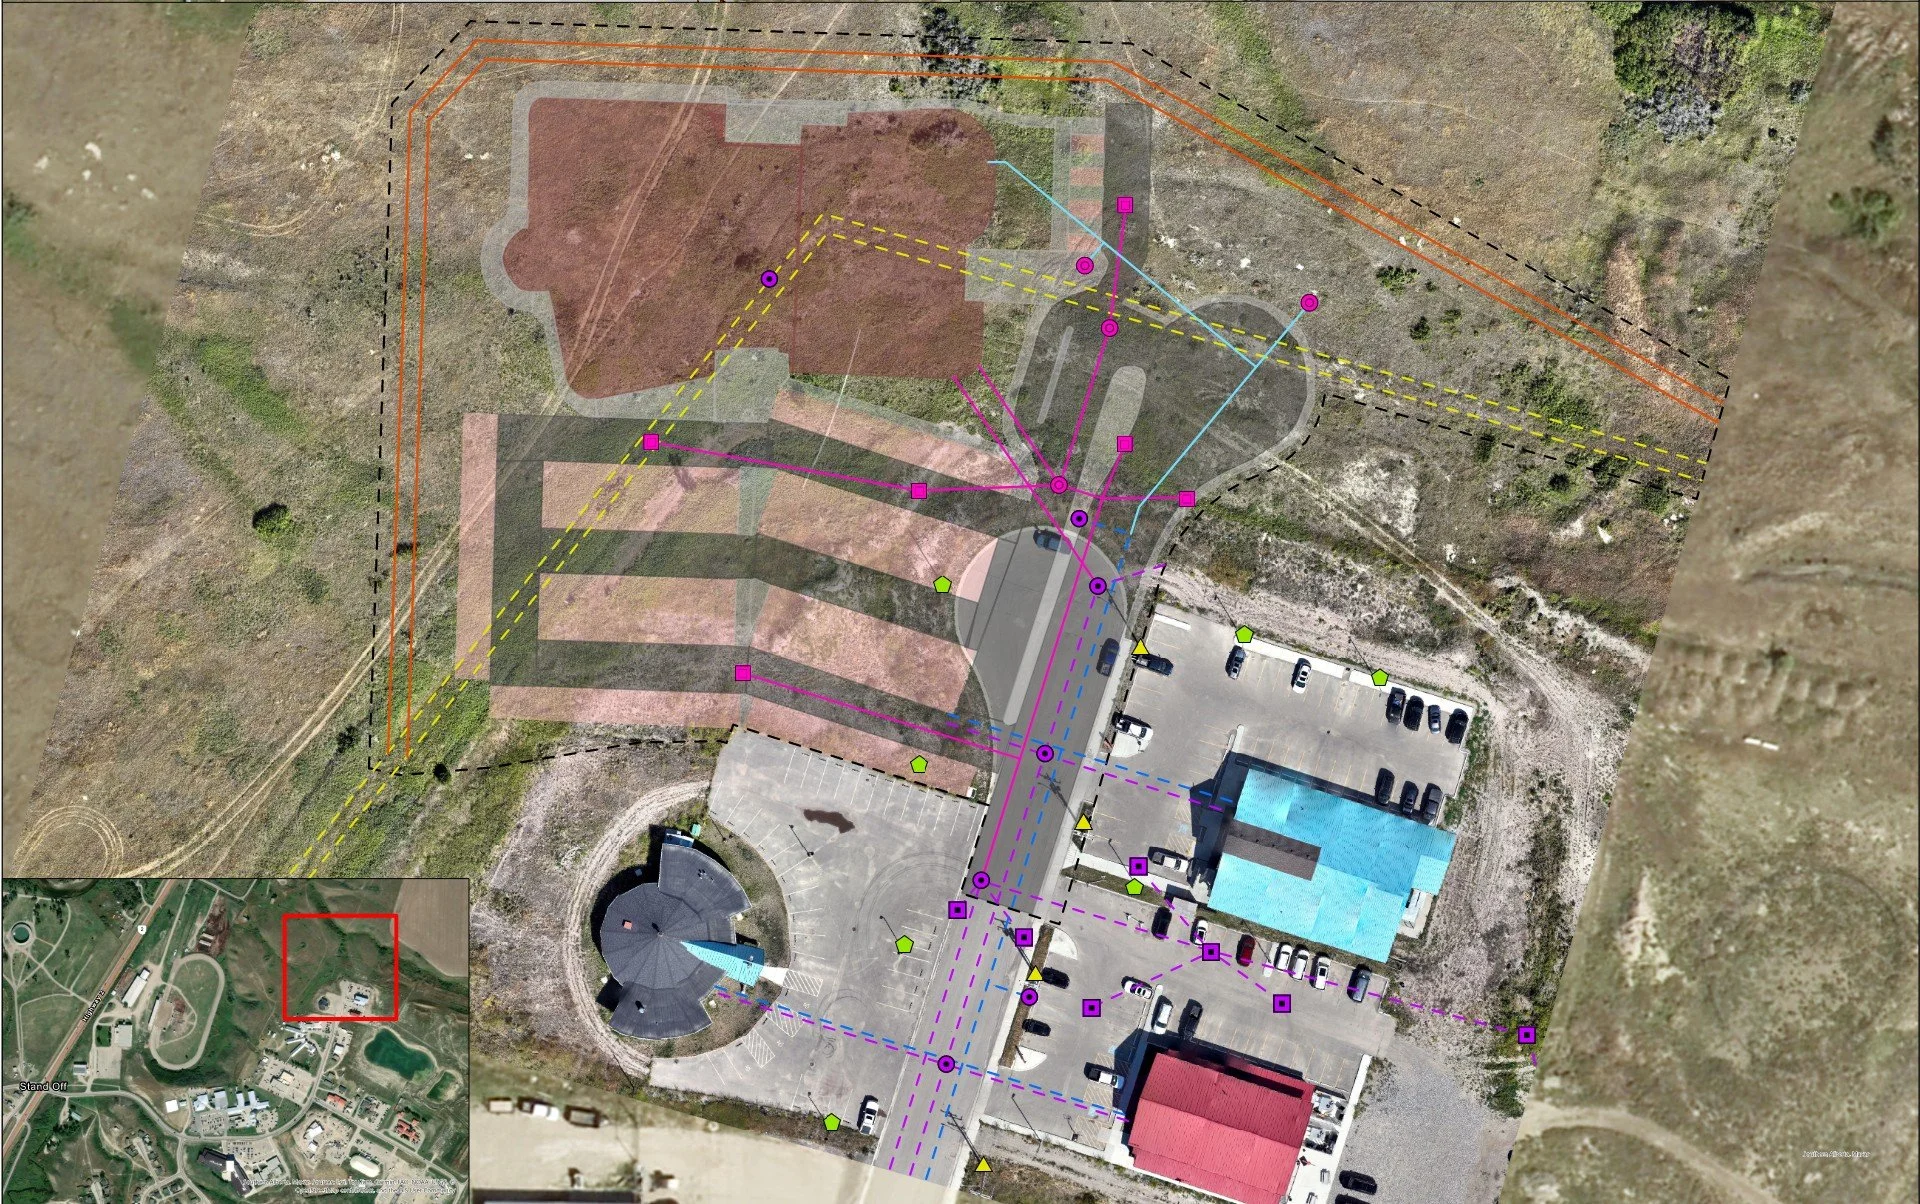
Reality capture tells you what’s there. GIS tells you what it means. We take the orthos, surfaces, and point clouds and layer them against the things that actually constrain a project — utilities, easements, environmental setbacks, land use, slope — to surface the relationships and risks that aren’t visible in any single dataset.
The output works on two levels. The analysis answers hard spatial questions; the cartography makes the answer legible to everyone who has to act on it.
The science and the art
GIS analysis is the engine. By layering datasets on common coordinates, we can ask compound questions — where are the slopes over 15% that also sit within a wetland buffer and drain the wrong way — and get an answer you can plan around. Terrain modelling, viewshed, suitability ranking, and hydrological routing all live here.
Cartography is how that answer reaches people. A map built with intent — clear hierarchy, honest symbology, the right things emphasized — lets a stakeholder, a regulator, or an investor grasp a complex site in seconds instead of squinting at an engineering drawing. Good map design builds trust; it shows you know the ground.
Where it helps, we move past static PDFs into interactive web maps your team can query and track against as the project moves.
Where it fits
• Site selection & feasibility — Aggregate environmental, regulatory, and topographic constraints to rank candidate sites and flag the no-go zones before money goes into design.
• Design & pre-construction — Georeference BIM and CAD into the real-world landscape, and model visual and environmental footprint to smooth permitting.
• Construction — Overlay scheduled captures against the design for clear planned-versus-actual reporting, and plan logistics on accurate layouts.
• Operations — Organize every asset into a searchable spatial database and hand operations a living dashboard instead of a drawer of drawings.